01 · A spreadsheet for exploring scenarios
2025 Feb 4
From calculating monthly budgets to planning dream vacations, spreadsheets are our trusted companions as we navigate life’s complex decisions—a playground for thinking, where possibilities come to life through numbers.
Spreadsheets are particularly useful for thinking through financial models, budgets, or any situation that involves considering lots of possible scenarios. Instead of laboriously redoing a bunch of math, you can quickly ask “what if?” questions and see the effects.
But, as great as spreadsheets already are for this task, we think they could be even better. In our Ambsheets project, we are exploring a small extension to the spreadsheet: what if a single cell could hold multiple values at once?
The problem of comparing scenarios
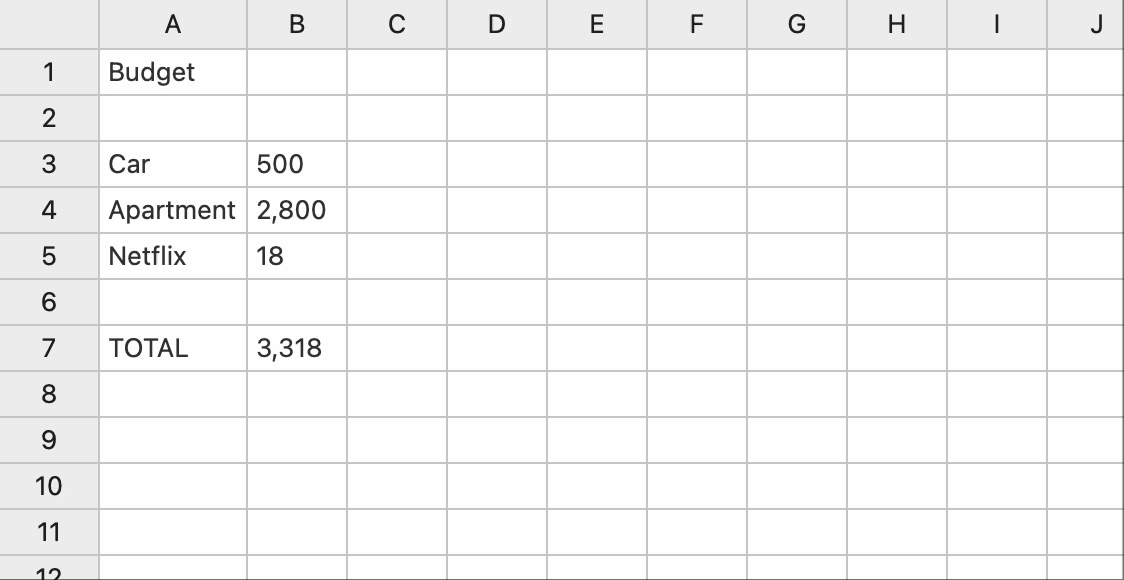
Suppose you’re moving to a new city, and you want to figure out how much you can afford to spend on your car, apartment, and other essentials each month. You start out by making a spreadsheet that sums up the various line items:
Now, you want to consider a few scenarios for possible cars and apartments. How might you compare those scenarios in the spreadsheets of today?
One thing you can do is toggle, by temporarily entering different values into a cell:
Toggling is straightforward because it doesn’t require restructuring the spreadsheet at all. But it has a key drawback: there’s no way to see all the scenarios at once!
Another option is to restructure by adding more columns to the sheet:
Restructuring does let you compare multiple scenarios at the same time, but it has its own drawbacks. It’s more work than toggling, because you need to pause and edit the layout. And it’s easy to run out of space—even in this small example, if you wanted to consider two possible cars and three possible apartments, your spreadsheet would grow rapidly.
Introducing amb values
Neither of the options above is fully satisfying. What if instead you could directly tell the spreadsheet that you’re considering multiple values for the price of the car? In an ambsheet, you can do just that:
The new value of B3, {500,1200}, means either 500 or 1200. We call this an amb value, and it represents one dimension in our possibility space. (Amb is shorthand for “ambiguous”, and is a reference to the nondeterministic evaluator from Abelson and Sussman’s Structure and Interpretation of Computer Programs.)
Amb values flow through the computation just like regular values and don’t require any special treatment in formulas. Cell B7, whose formula is SUM(B3:B5), now evaluates to either $3,318 or $4,018—this is what your total monthly spend will be if you decide to lease the car that costs $500/month or the car that costs $1,200/month, respectively.
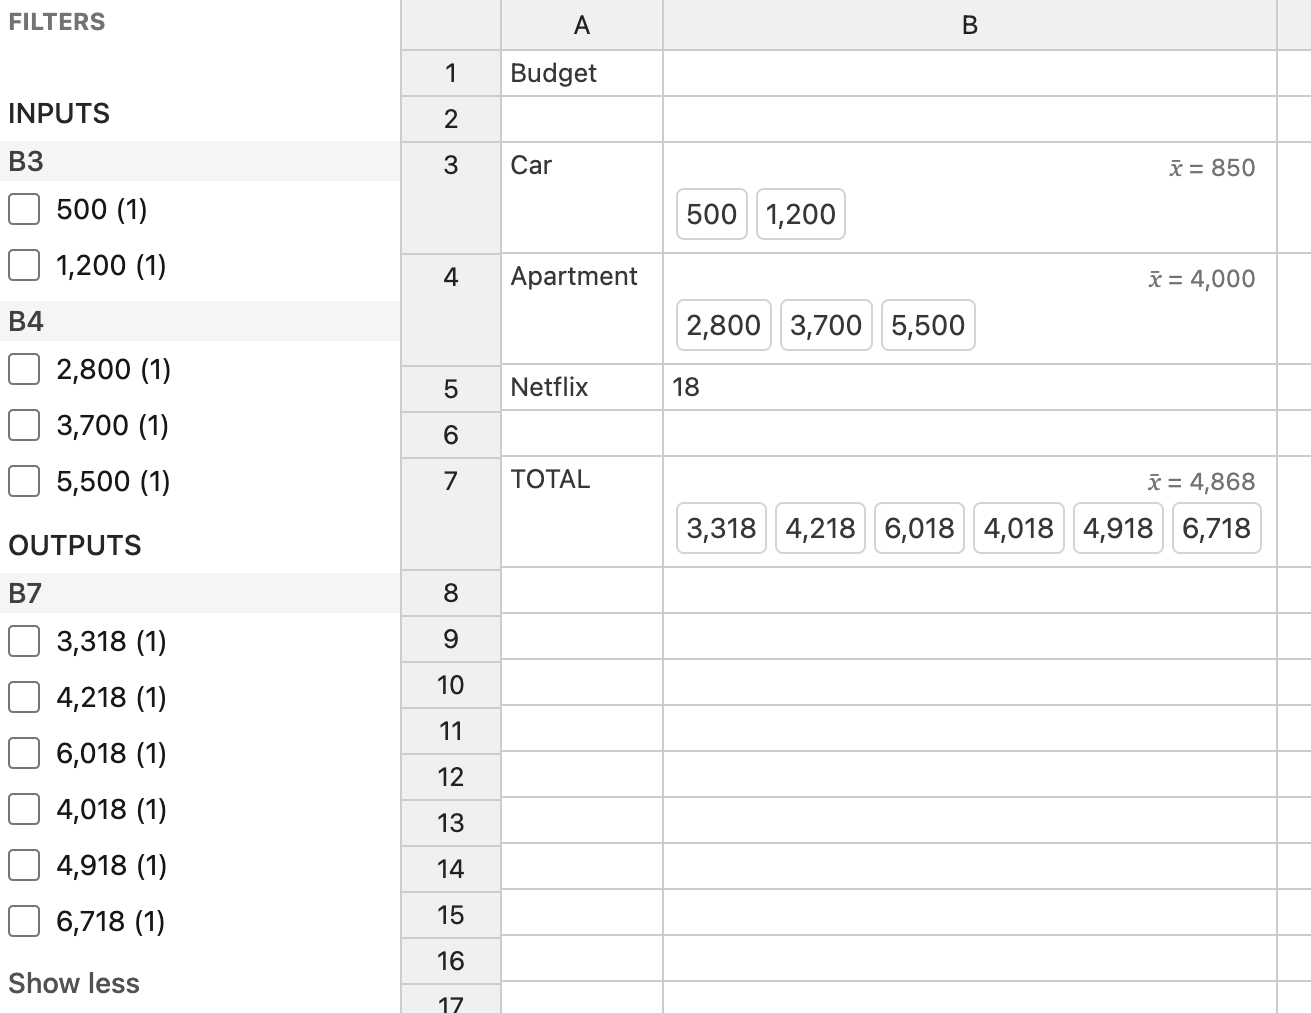
If you’re willing to spend up to $5,000, you may also want to consider apartments that are larger and/or in nicer neighborhoods. In our ambsheet, all we have to do is change B4 to an amb value:
Now the total monthly spend (cell B7) has 6 different values, one for each possible scenario:
- in the 1st one, we leased the $500/month car and rented the $2,800/month apartment,
- in the 2nd one, we leased the $500/month car and rented the $3,700/month apartment,
- … and so on.
We say this possibility space has two dimensions because there are two different amb values where we are making a choice. We can visualize the possible values of B7 in a 2-dimensional table:
Within each scenario, an ambsheet operates like a normal spreadsheet—the SUM formula only sees “regular” (non-amb) numbers. Behind the scenes, the ambsheet’s evaluator takes care of enumerating all possible scenarios and running the formulas for each one.
Ambsheets aren’t limited to 2 dimensions. For example, if you’re choosing among different Netflix plans, you could turn the last budget item into an amb value, resulting in a 3-dimensional possibility space. This is more flexible than doing restructuring in traditional spreadsheets, where you’re limited to the 2D grid.
What about Excel’s “What-if”?
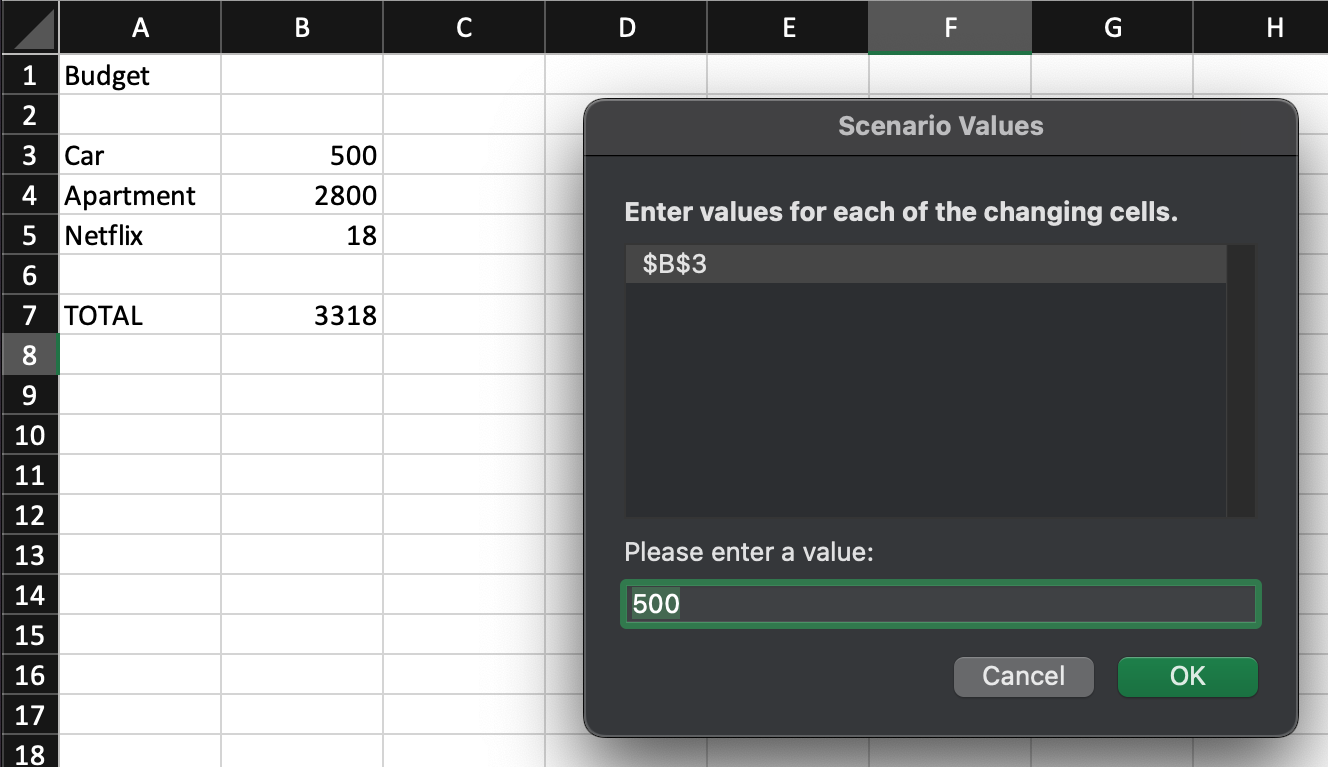
If you’ve used What-If Analysis in Microsoft Excel, some of these ideas may seem familiar. That feature aims to solve the same problem as Ambsheets, but there are two key differences.
First, What-If Analysis has a clunky UI that’s not integrated into the spreadsheet itself. You need to open a separate mode to enter cell values or view the possible scenarios. In an ambsheet, you can start exploring scenarios right within the sheet itself.
We also take a different approach to enumerating scenarios. Excel requires the user to manually enter every scenario—even in the simple example above, exploring 2 cars, 3 apartments, and 2 Netflix plans would require entering 12 scenarios, with names like “Cheap Car / Medium apartment / Premium Netflix”. In contrast, an ambsheet automatically computes all combinations of the three amb values.
Going deeper
That covers the basics of amb values, but many questions remain if we want to grow this kernel into a powerful medium for exploring scenarios.
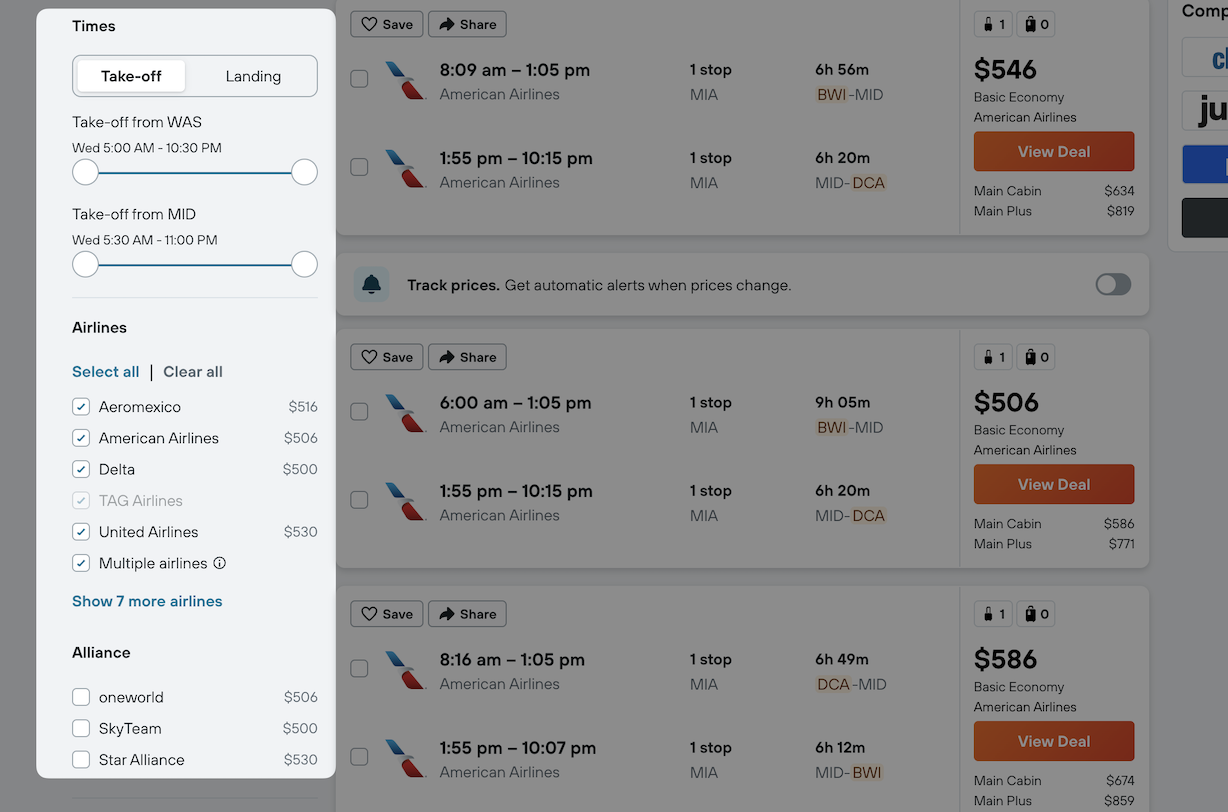
- Filtering: How can you interactively explore large possibility spaces and narrow down to the subset of scenarios that you care about?
- Visualization: A table works fine for visualizing six values in two dimensions, but how do you show hundreds of possible values across many dimensions in a useful way?
- Continuous distributions: What does it look like to have an amb value that represents a probability distribution rather than a list of discrete values?
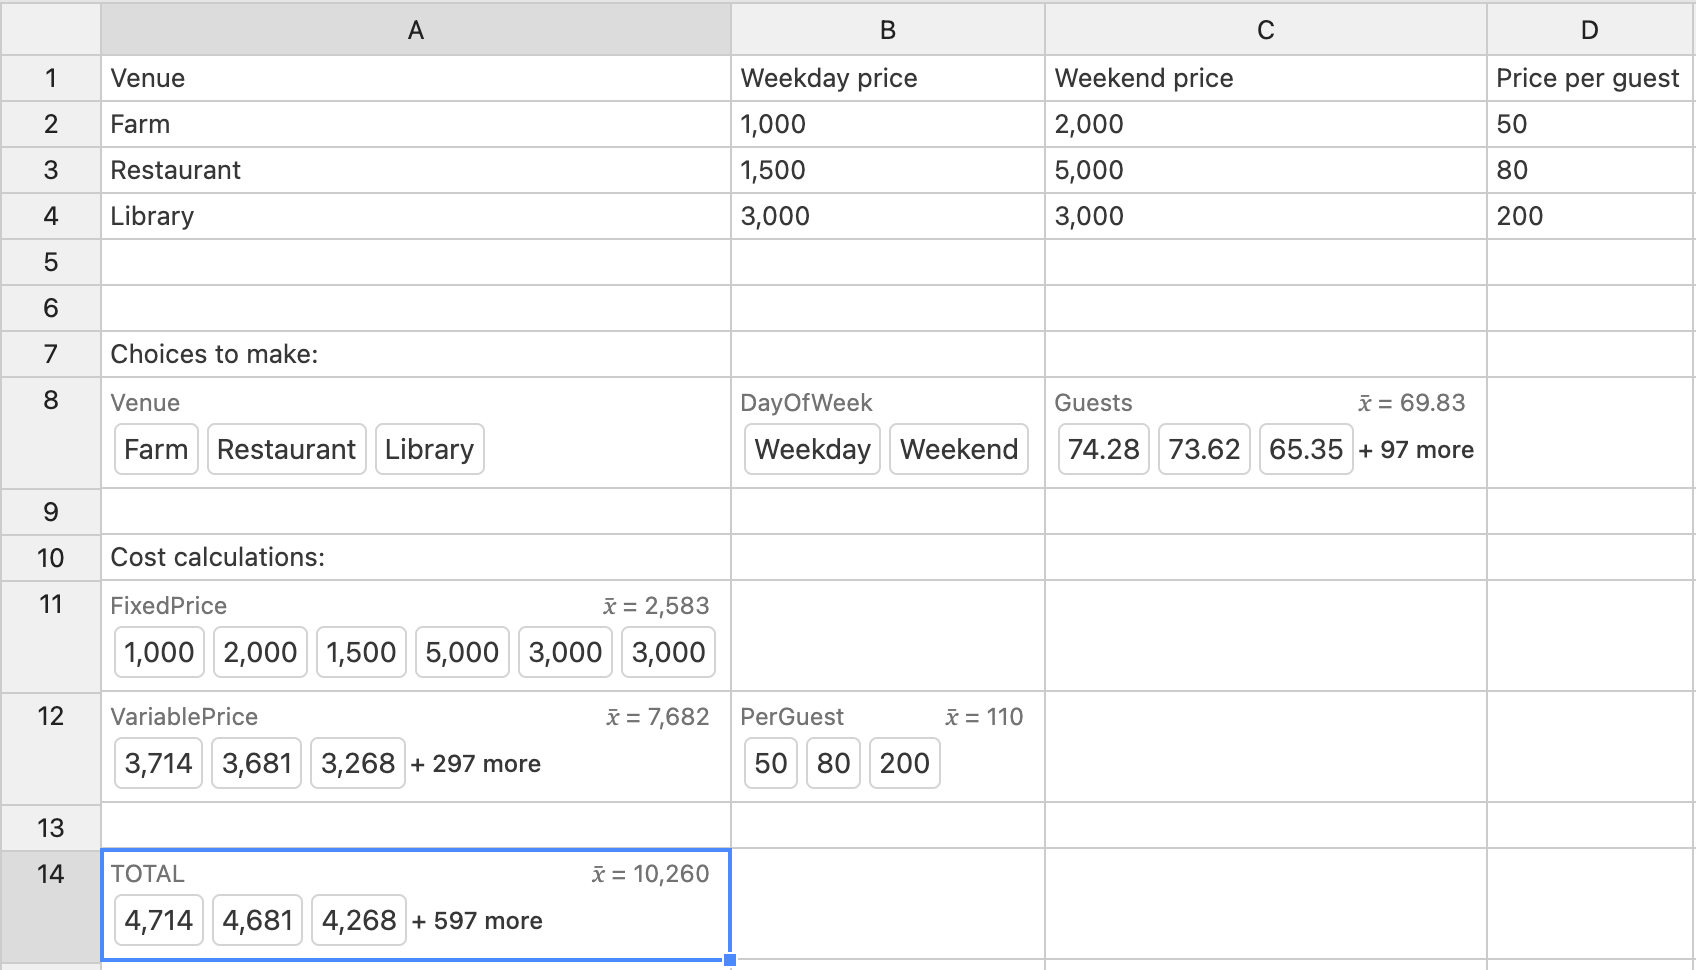
- Applications: How can ambsheets apply to specific domains of decision-making? For example, could you make an ambsheet for budgeting, or for analyzing card games?
We’ve been exploring these questions and more, and we’ll be posting the results of our experiments in this lab notebook.
If you have a problem that you think might benefit from Ambsheets, we’d love to chat—please reach out to us at alexwarth@inkandswitch.com and geoffrey@inkandswitch.com.